I haven't blogged for a long long time, and haven't been knitting so much lately, but since I've been designing some more stuff lately I figured now would be a good time to start it up again.
The idea of this one is to make a two-sided hat, with the outside just plain colours, but the inside patterned using the cosmic microwave background (CMB) map. The idea is that from the outside it looks simple, but hidden away is all the complexity in the universe.
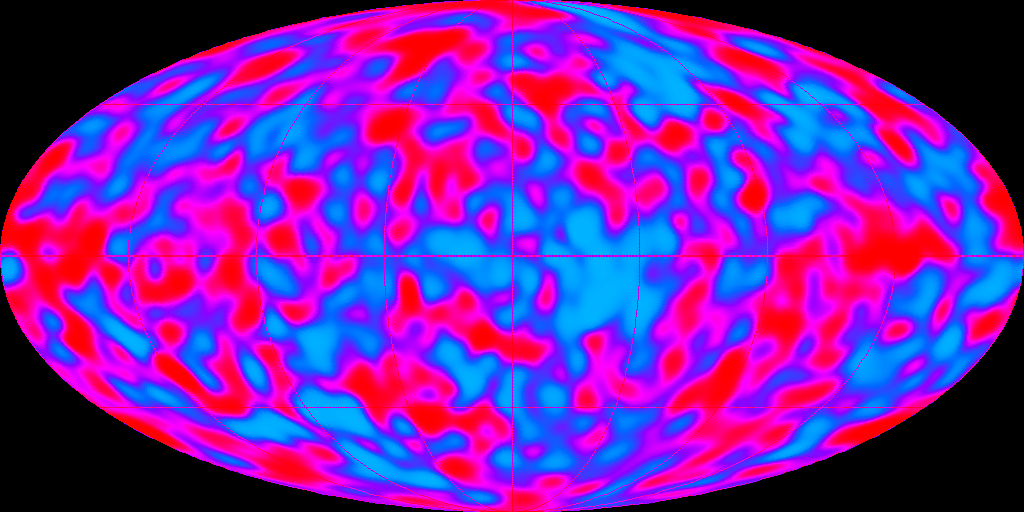
I probably need to say more about the CMB - shortly after the big bang, the universe was dense, hot and opaque. As the universe expanded it cooled, matter condensed, and galaxies and stars began to form, and the universe became largely transparent. As this happened, that primordial light continued on its way, cooling as space expands around it. It was calculated that given the age of the universe, this light would have a specific temperature associated with it, around 3K (-271 C). Finding this experimentally was an incredible result, and crucial to our current understanding of the universe. This was theorized in the 1950s, verified experimentally in the 1960s, and generally accepted in the 1970s.
Even more incredible, in the 80's, scientists then started looking at 'anisotropies' (small differences in the CMB). There's a couple of large features, but the really interesting bit are the "fluctuations". These are thought to be caused by quantum fluctuations in the early universe, tiny random changes which led to slight instabilities and were magnified as the universe expanded. The idea is that these fluctuations led to the instabilities which would later form into clusters, galaxies, and stars, and all the structure in the universe. If this is right, these fluctuations could record the very earliest history of the universe, the cause of all the large-scale structure of everything. These fluctuations were first mapped by the COsmic Background Explorer (COBE) satellite in 1992, although more detailed maps have been produced since.
For knitting purposes, converting this map into a useable chart has some interesting challenges - the CMB map is complex and intricate, and the shaping of a hat is non-trivial, so producing a chart by hand would require a lot of work.
Instead I'll be doing this computationally (more on this another time) - using row and stitch numbers to map from individual stitches to a system of polar coordinates, which can then be found in the image and its colour determined. Doing it this way also means that it's almost trivial to recalculate this for different sizings, just a matter of changing some parameters are re-running the program.
It also means that a different source image could be substituted - this will then make a hat pattern with the new image embedded in it. That said, there's a few approximations made with the coordinate systems, and I'll need to try it out to see how much distortion these cause - of course the CMB map is quite forgiving of this kind of thing, but other images may not be.
That's the plan anyway - pictures when the hat is complete!
Hugh.